Mapping the research literature: bibliometrics with VOSViewer
Published:
Scanning research literature is a fundamental task across all academic fields. Gaining an overview of previous studies is crucial for understanding the advances and identifying gaps in the literature. Bibliometrics, which refers to the statistical analysis of bibliographic data, is a powerful tool for mapping content on a specific topic. Two excellent tools for conducting bibliometric analysis are the Bibliometrix package in R and the open-source software VOSViewer—both publicly and freely available. Bibliometrix includes a user-friendly function, biblioshiny(), which launches a web application that provides detailed information about authors, publications, and institutions after importing bibliometric data from databases such as Scopus or Web of Science. The best part? It requires no coding skills, making it accessible to users with limited technical expertise. VOSViewer is ideal for building network maps of co-authorship and co-occurrence of keywords. It employs clustering techniques to reveal connections between keywords and identify research trends. The tool is straightforward to use: simply export the bibliometric data from databases like Scopus or Web of Science and import it into the software. Below is a step-by-step guide to help you get started with VOSViewer.
Step 1: Downloading the Bibliometric Data
The first step in any bibliometric analysis is downloading the relevant data. This can be done by exporting files from databases such as Scopus or Web of Science. VOSViewer supports specific databases and requires the data to be in particular formats. For example, data extracted from Scopus must be compiled into a CSV file. When exporting the file, make sure to select the “CSV” format. Important Tip: Before downloading, uncheck the boxes for “Corresponding Author” and “Funding Text.” If these options remain selected, VOSViewer may generate error messages when processing the file.
Step 2: Creating a Network Map Once the bibliometric data is ready, you can create a network map in VOSViewer by following these steps:
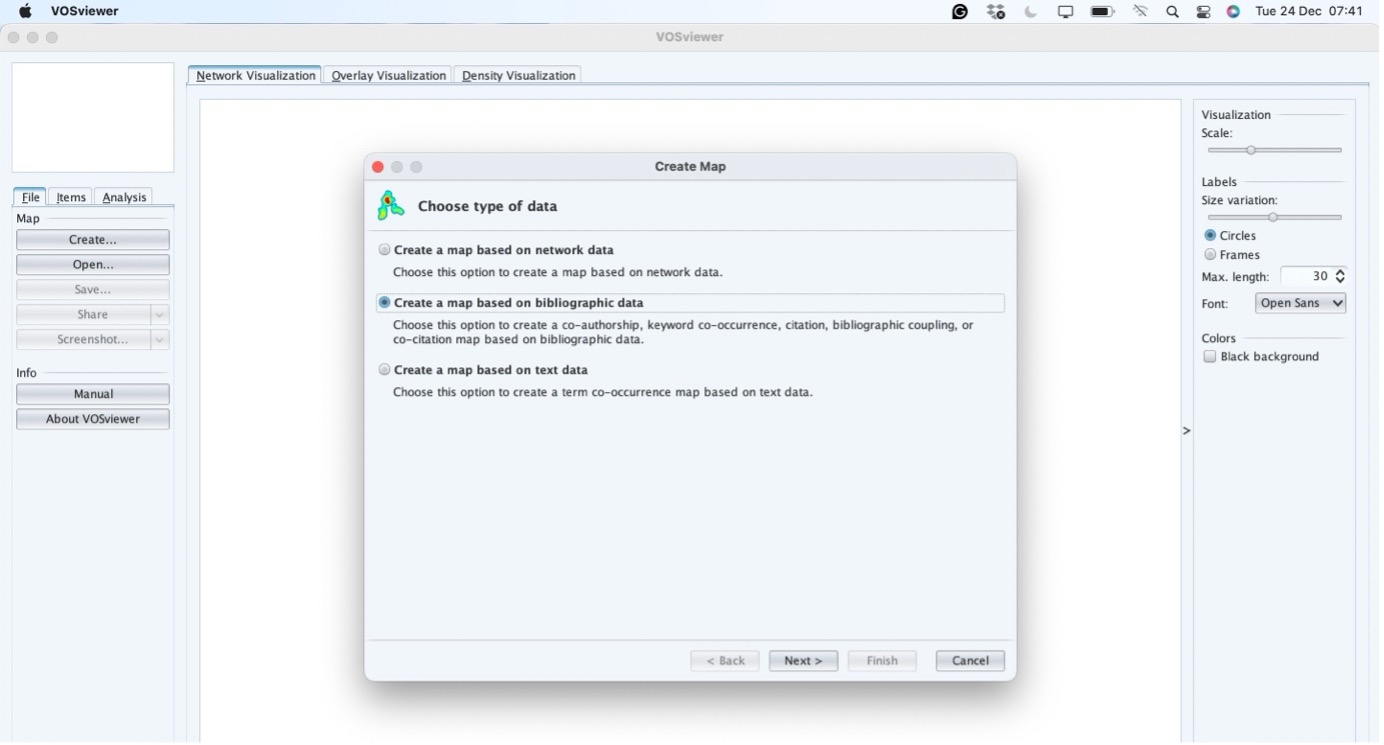
- Open the software and press “Create…”.
- You will see three options: o (1) Create a map based on network data. o (2) Create a map based on bibliographic data. o (3) Create a map based on text data. For bibliometric analysis, select the second option to use data from bibliographic databases. This option is suitable for creating maps of co-authorship or co-citation networks. If you want to analyse keywords or abstract text, select the third option.
- Follow the prompts to upload your data and adjust the settings as needed. VOSViewer will generate a visualisation that highlights connections between authors, keywords, or institutions based on your chosen parameters.
Step 3 – Reading the data
After downloading the bibliometric data, the next step is to upload it into VOSViewer. Since this example uses a database file from Scopus, the data format must be CSV.
- Open VOSViewer and select “Create…” from the main menu.
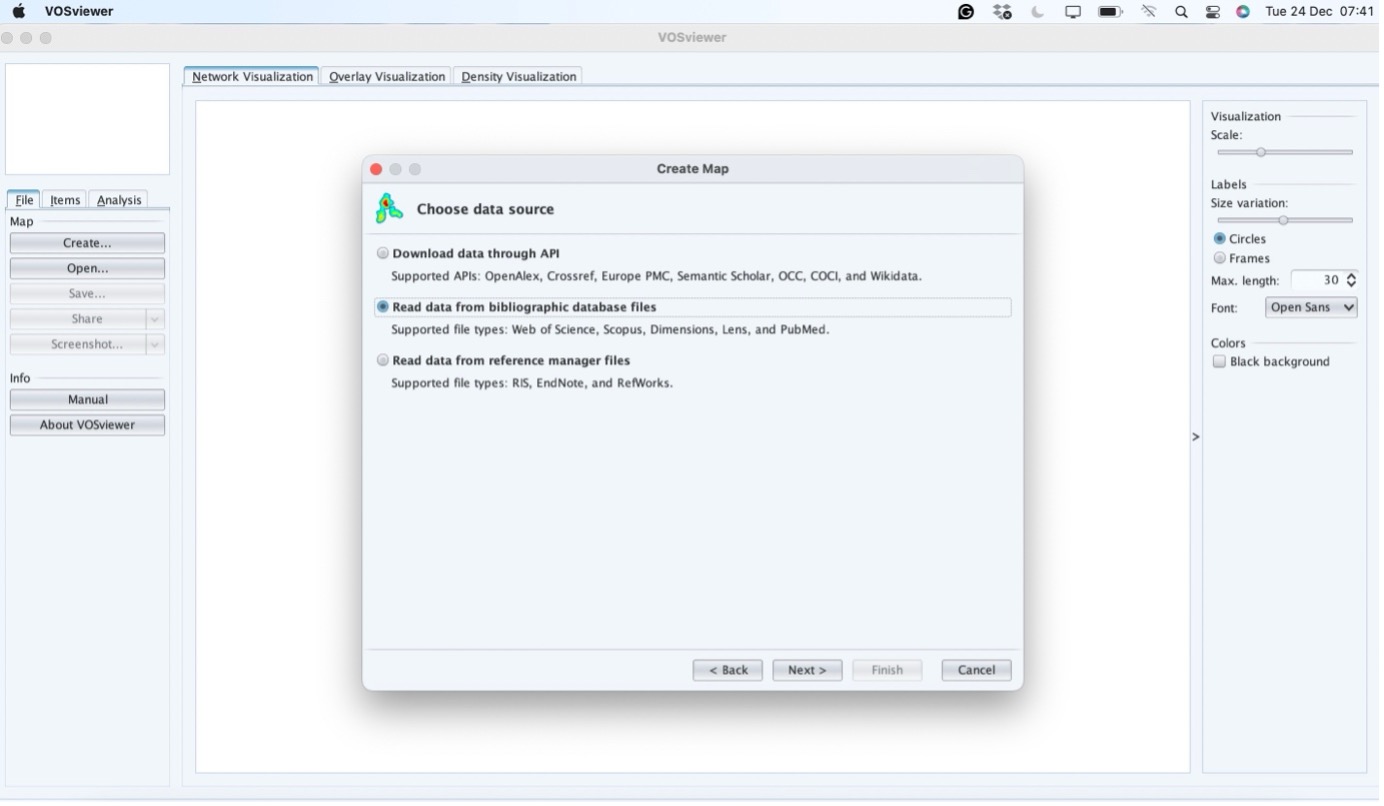
- When prompted to select a data source, choose “Scopus” (as we are working with Scopus data).
- Navigate to the folder where your CSV file is saved, select the file, and click “Open”. VOSViewer will process the file and automatically read the necessary information. If any errors occur, ensure the downloaded file meets the formatting requirements (e.g., excluding unnecessary fields such as “Corresponding Author” or “Funding Text,” as mentioned earlier). Once the data is successfully read, you can proceed to customise and generate visualisations, such as co-authorship networks, citation maps, or keyword clusters. This step is pivotal for exploring the relationships and patterns within your bibliometric data.
Step 4 – Choosing parameters
After successfully importing the data into VOSViewer, the next step is to configure the parameters for your analysis. This involves selecting the type of map you want to create and the specific data to be analysed. In this example, we will focus on creating a keyword map.
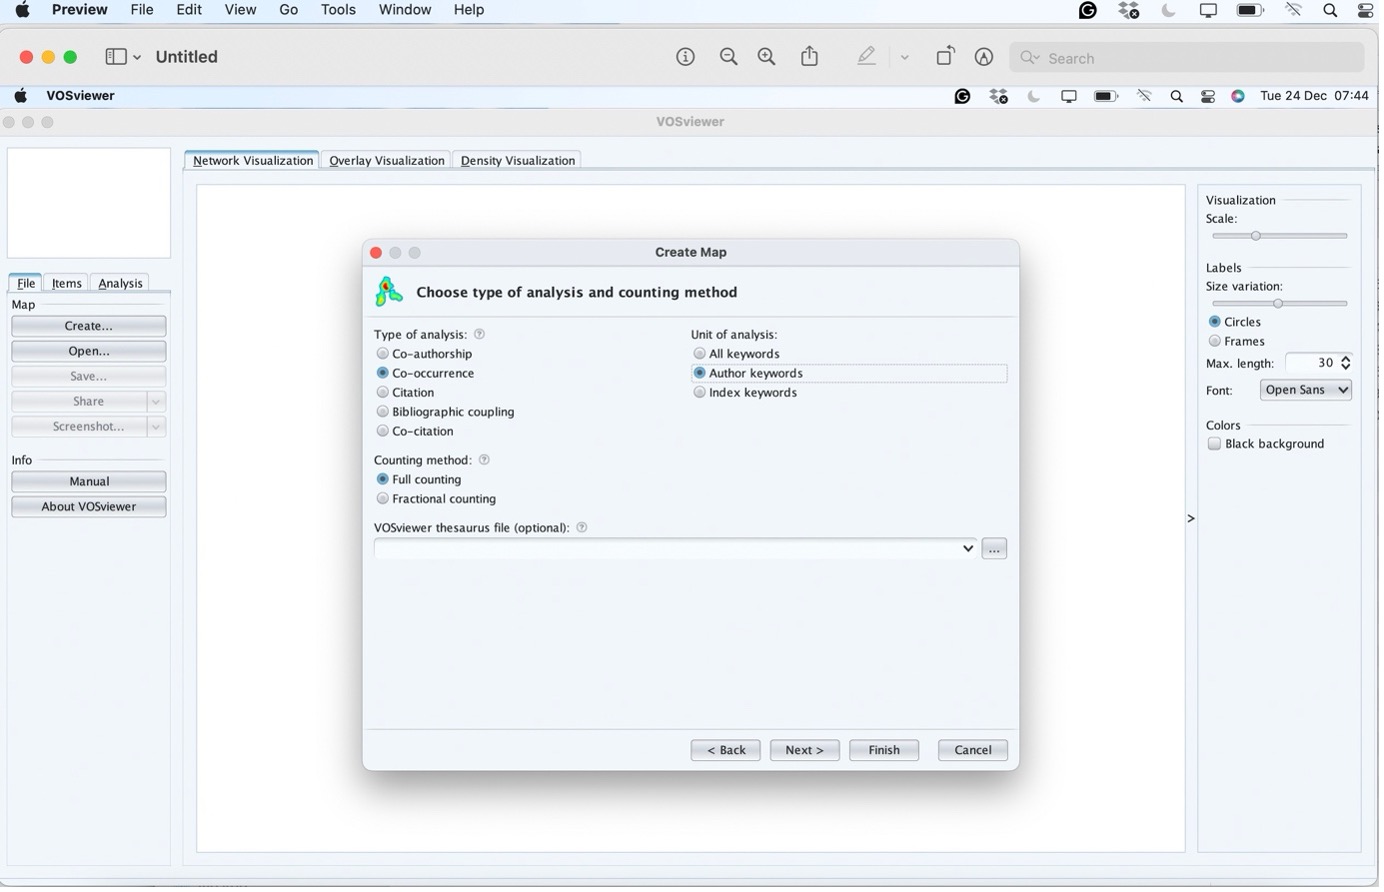
- In the “Create a Map” dialogue box, select “Co-occurrence” as the type of analysis. This option is used for mapping the relationships between keywords. o If you are mapping relationships between authors, you would choose “Co-authorship” instead.
- Next, choose the type of keywords you want to analyse. VOSViewer provides two options: o Author keywords: These are the keywords provided by the authors of the publications. o Index keywords: These are keywords assigned by the database (e.g., Scopus or Web of Science). To simplify the process, it is recommended to select “Author Keywords”. This option focuses on the terms authors intentionally used to describe their work, making it easier to identify relevant themes and connections.
- Click Next, and VOSViewer will guide you through additional options, such as setting thresholds (e.g., the minimum number of occurrences for a keyword to be included in the map). Adjust these settings according to your research objectives. Once the parameters are set, VOSViewer will generate a visualisation of the keyword network. This map will display clusters of related keywords, with connections representing their co-occurrence in the literature. You can use this map to explore research trends, dominant themes, and gaps in the field.
To enhance the accuracy of your keyword analysis in VOSViewer, you can upload a thesaurus file. A thesaurus serves as a dictionary that standardises terms to avoid duplication. For instance, keywords such as “politicization” (American English) and “politicisation” (British English) would typically be treated as separate terms. By using a thesaurus, these variations are merged into a single keyword, ensuring your results are more consistent and accurate. Why Use a Thesaurus? • Avoids duplication of terms with different spellings or synonyms. • Standardises keywords to ensure cohesive clustering. • Improves the quality and reliability of the network map. How to Add a Thesaurus File in VOSViewer
- Prepare the Thesaurus File o The file should be in a plain text format (.txt) with two columns: Replace: Lists the variations of the term. By: Specifies the standardised term to use.
- Upload the Thesaurus File o In the VOSViewer setup, after selecting your map parameters (e.g., co-occurrence of keywords), you will find an option to upload a thesaurus file. o Browse to your thesaurus file and upload it before generating the map.
- Generate the Map o VOSViewer will apply the thesaurus file to merge variations into standard terms, ensuring your analysis reflects unified clusters and eliminates redundancies. Future Guide I will publish a detailed tutorial on creating and formatting a thesaurus file for VOSViewer in an upcoming blog post. This guide will cover best practices for compiling terms, handling synonyms, and dealing with database-specific variations to make your bibliometric analysis as accurate as possible. Using a thesaurus is optional but highly recommended for advanced analyses or when working with large datasets that may contain diverse spellings or synonyms. It’s a simple yet powerful way to refine your results.
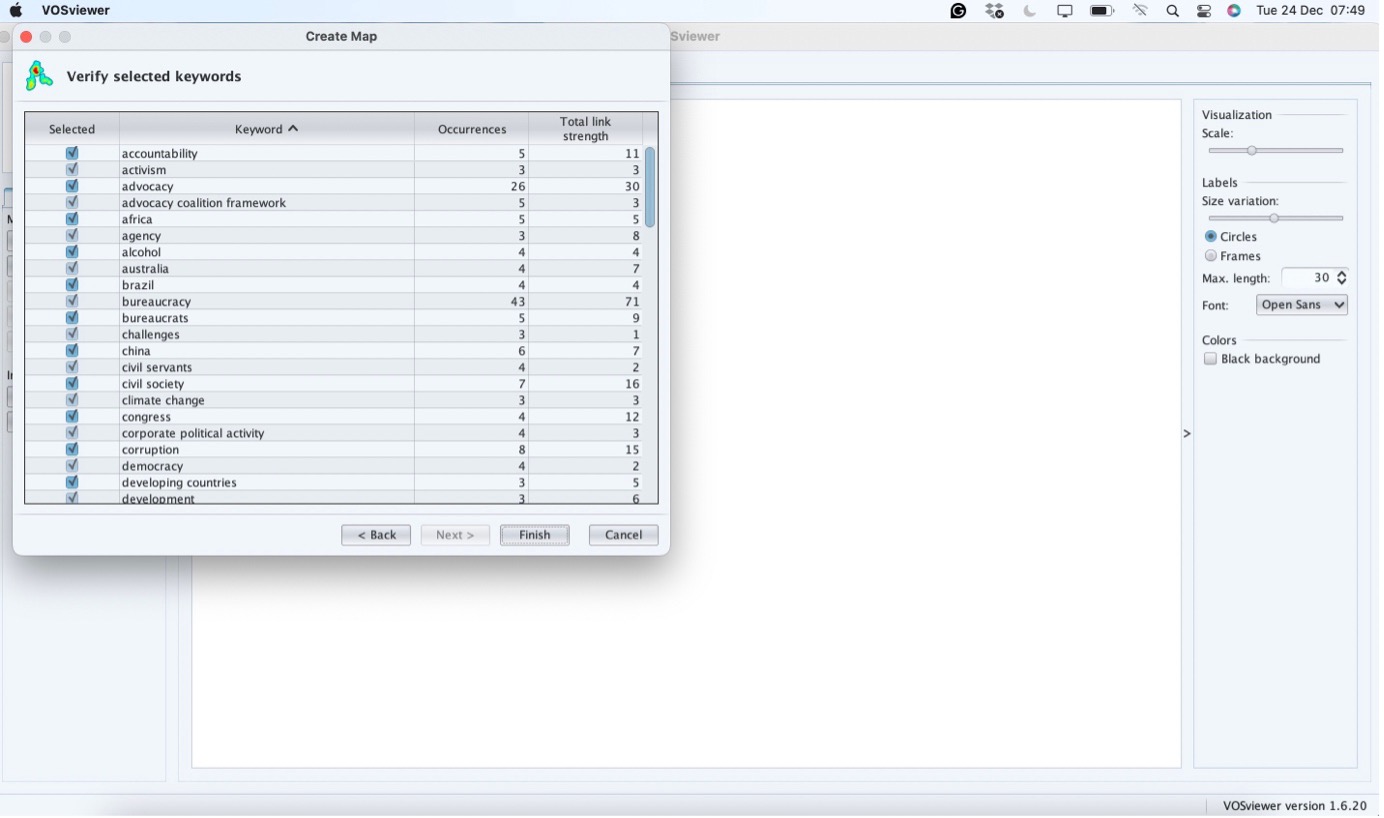
Step 5 – Choosing the number of occurrences
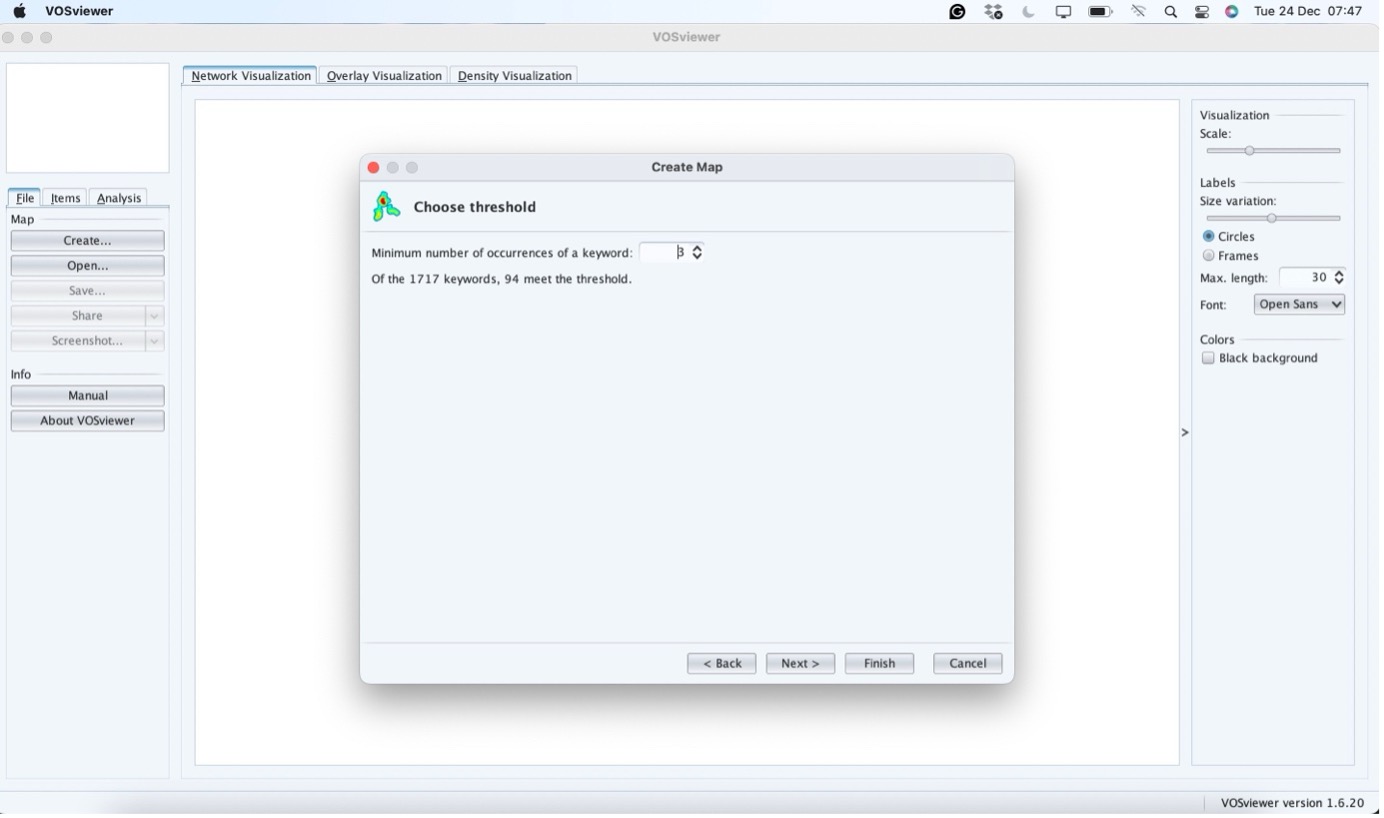
The next step in the process is to select the minimum number of occurrences for a keyword to be included in the network map. This decision will shape the level of detail and the focus of your analysis. What Does “Occurrences” Mean? • Occurrences refer to the number of times a keyword appears in your dataset. • Setting a threshold helps filter out less frequent terms, ensuring the map highlights the most relevant keywords for your analysis. How to Choose the Number of Occurrences There is no universal rule for selecting the threshold, as it depends on the research objectives and dataset size. Consider the following guidelines:
- If You Want a Broad Overview: o Decrease the threshold to include more keywords with fewer occurrences. o This approach is useful for identifying a wider range of terms and exploring less dominant themes.
- If You Want to Focus on Core Keywords: o Increase the threshold to include only the most frequent and significant terms. o This is ideal for highlighting dominant research trends and themes.
- General Recommendation: o For small to medium datasets, a threshold of 3 to 10 occurrences is often appropriate. o For large datasets, you may set a higher threshold to avoid clutter in the network map. Example If your dataset contains thousands of keywords, setting the threshold at 5 occurrences ensures only keywords appearing five or more times are visualised. This strikes a balance between including sufficient detail and maintaining clarity in the map. Customising Your Map Once you set the occurrence threshold:
- VOSViewer will generate a preliminary map.
- Review the visualisation to ensure it aligns with your research goals.
- If needed, adjust the threshold and regenerate the map to refine your results. Selecting the right number of occurrences is a critical step that depends on your specific research questions. Experiment with different thresholds to find the balance that best suits your analysis.
Step 6 – “Finish”
Click “Finish” to generate your network map. If VOSViewer alerts you about unconnected items, you can choose to visualise either: • Only connected items: Ideal for exploring relationships between themes. • All items: Useful for examining all frequent keywords, regardless of connections. Your choice depends on the research goals. Focus on connected items for analysing thematic networks or visualise all items for a broader overview. 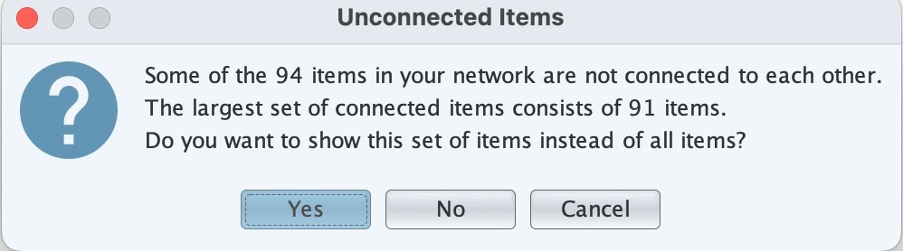
The final map looks like this: 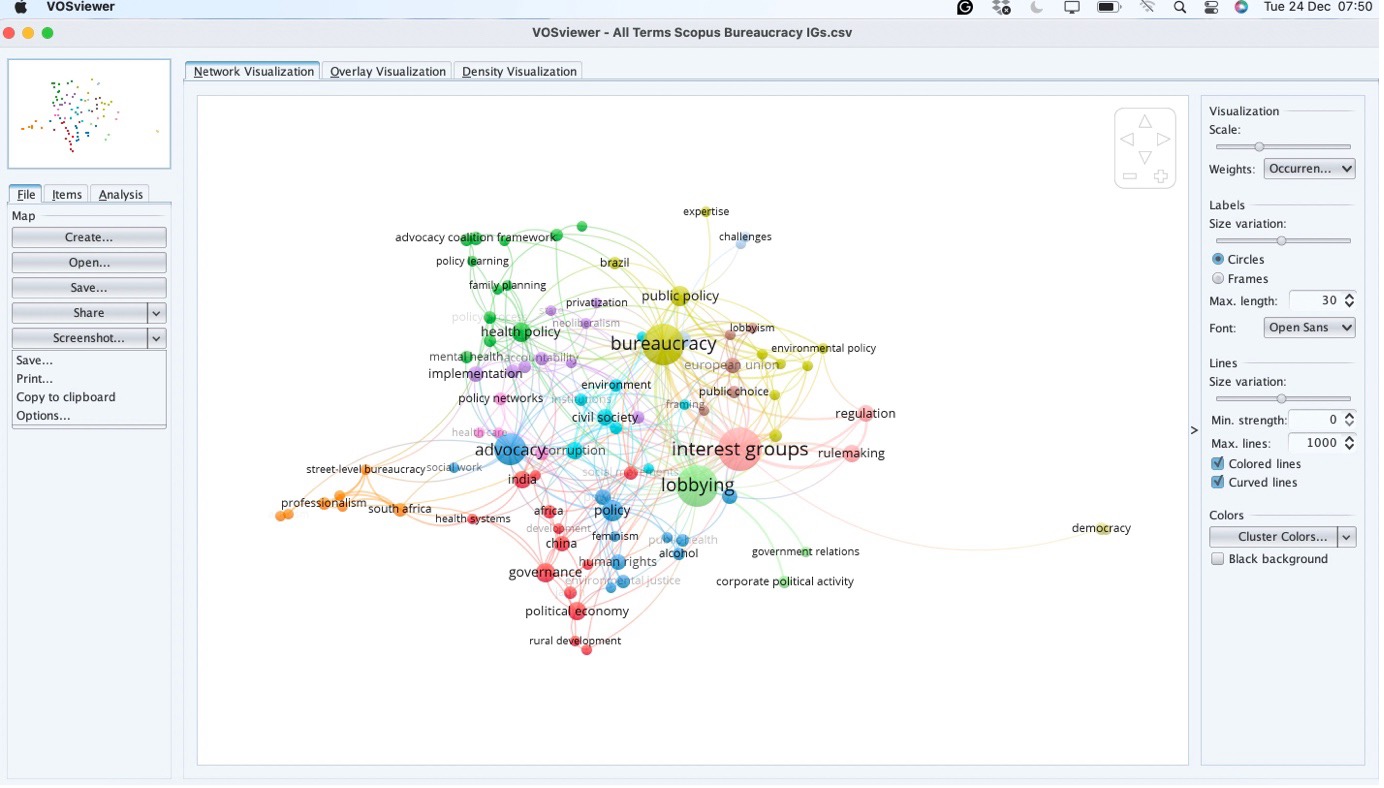
The size of the circles in the network map reflects the occurrence of keywords, while the thickness of the lines indicates the strength of their connections (van Eck and Waltman, 2010). Clusters represent sets of connected items, helping to identify common themes in the literature. For example, in the generated map, keywords like “bureaucracy” and “interest groups” belong to different clusters, suggesting limited interaction between these two research areas. A qualitative assessment of the literature supports this finding: studies on lobbying often mention public bureaucracy but primarily focus on elected officials rather than the relationship between interest organisations and government officers. Moreover, distinct terminologies highlight this divide. Studies on lobbying use terms like “revolving doors” to examine connections between bureaucrats and lobbyists, whereas research on public bureaucracy emphasises relationships between bureaucrats, political parties, and presidents (Albrecht, 2023). This network map not only visualises these gaps but also helps generate hypotheses for further investigation through deeper text analysis. Thus, scientific mapping plays a crucial role in identifying and addressing gaps in the literature, advancing research understanding.
References
Albrecht, Nayara F Macedo de Medeiros. 2023. “Bureaucrats, Interest Groups and Policymaking: A Comprehensive Overview from the Turn of the Century.” Humanities and Social Sciences Communications 10: 1–10. https://doi.org/10.1057/s41599-023-02044-8.
Eck, Nees Jan van, and Ludo Waltman. 2010. “Software Survey: VOSviewer, a Computer Program for Bibliometric Mapping.” Scientometrics 84 (2): 523–38. https://doi.org/10.1007/s11192-009-0146-3.